How to Use Business Process Mapping to Improve Data Quality
- 5 minutes read
- Author: Mamita Mallina
How is it that organizations invest plenty of resources in data platforms to help them manage and cleanse their data… and yet, they still have missing, duplicative, or unusable data? This undermines all the trust in the data that the IT teams have worked so diligently to build.

One culprit might be a lack of visibility into the organization’s business processes. Perhaps the organization has grown so large that it’s hard to manage its processes. Or perhaps the organization has gone through numerous mergers and acquisitions that have introduced a mishmash of overlapping processes.
Whatever the cause, the outcome is that the organization doesn’t fully understand which applications are creating data, what data is being created or duplicated, what outside sources are supplying data, where data is being used, where data is being stored, or the impact of bad data on downstream systems.
Organizations use business process maps to define, analyze, and visualize their processes. Their goal is to determine the gaps, overlaps, leaks, and silos in the current process. This also helps in identifying problem areas as well as dependencies.
Here is how our business process mapping service helps improve data quality for our clients:
1. Incorporate the Flow of Data into the Business Process Map
Understanding business processes is a critical component of improving data quality – and trust in your data. As we know, good, clean data is critical for enabling ROI from data analytics.
Yet when the business operations teams work on business process mapping, they don’t always look at it from a data flow perspective. These days, it’s imperative to collaborate with IT/data teams to incorporate the flow of data between systems into the process map. The goal is to identify the systems used in the process and to trace where data inaccuracies/risks may occur.
 A business process map can become extremely complex. It would not be unusual for a business process map to include dozens or hundreds of macro-processes. Each macro-process could supported by micro-processes. Here is an example of a simple business process map. The red exclamation marks indicate disconnects, issues, pain points, or gaps in the business process or the systems.
2. Evaluate the Current State, Desired State, and Data Flow Gaps
Once you’ve added systems and flows into your business process map, the next step is to do a gap analysis. We do this by creating a spreadsheet that details the pain points in the current state, the desired future state, and recommendations for remediation for each step in a macro-process. Our gap analysis focuses on the data flow gaps – where is there duplication in data entry, what are the third-party sources of data, where is data stuck in an employee’s email, and where is data siloed due to lack of integration? We also like tracking applications/platforms used and data sources provided.
 Here you can see the Business Process Gap Analysis Template that we use with our clients: Download our Business Process Mapping – Gap Analysis Template.
3. Categorize the Gaps Based on Type of Remediation
Even after you’ve created an inventory of gaps, it can still be overwhelming to get started in fixing your system! When we consult with companies on business process mapping, we start by categorizing the gaps into eight distinct buckets based on the type of remediation recommended. Here are the typical remediation categories we frequently use:
- Automation – Replace human processes with digital workflows to drive consistency and reduce errors
- Security and Compliance – Mitigate risk through enterprise-wide security standards
- System Integration – Remove islands/silos by connecting systems
- Digital Experience – Modernize/build new digital experiences to remove friction
- Technology Modernization – Mitigate dated technology challenges
- Analytics – Drive proactive data-driven decision-making with analytics
- Process Improvement – Fix inconsistencies, improve definition, and engage in training
- Data Quality and Governance – Drive operational efficiency, and trust in data-driven decisions
After placing all the gaps into categories, we can then analyze the dependencies, and build a long-term roadmap that prioritizes quick wins and progress in manageable increments. Here is an example of how we applied this process with a recent client:
Example of Using Business Process Mapping to Identify Data Flow Gaps
Costrategix was engaged to consult with a workforce management company that had grown significantly through over two dozen mergers and acquisitions within a few years. These acquisitions resulted in a huge influx of employees, consultants, and software systems. The business did not standardize its processes when it absorbed the merged companies. Unsurprisingly, it was struggling to build a unified data analytics system.
We started by helping the company map out its business processes around the key elements of recruiting: 1) Hiring 2) Onboarding and 3) Termination. We created 40 macro-level process maps and several micro-processes. We used this to identify all the systems being used – and importantly, data inaccuracies/omissions/data integrity issues in the systems.
The process maps helped identify opportunities for optimization. We then performed a Gap Analysis to recognize steps that were duplicative or repetitive, activities and tasks that were causing delays, and tasks that were not being performed by team members because of the interdependencies between the steps in the process.
Here are a few examples:
- Recruiters, hiring managers, and payroll specialists duplicated data entry about new applicants into three separate systems: the Applicant Tracking System, the HR system, and the payroll system. There was no data validation across systems, and data fixes made in any one system were not in sync with the other systems.
- The entire team used a single email for communicating employee and prospect information between teams and systems. This caused problems since not only is email an informal channel, but also when the mailbox became full, the organization lost reams of information.
- When communication broke down anywhere in the cycle, payroll was impacted. In more than one case, the organization continued paying for benefits and training for employees long after they left the organization, which became a huge revenue leak.
- When an employee was let go or furloughed in the middle of an expensive training program, there was no consideration given to whether that person was also training other employees and how that would impact the program.
- While the organization created checklists of processes required at every stage of the recruiting, onboarding, and termination processes, many of them ended in an infinite loop – that is, if one item could not be completed (i.e. an employee left without returning a badge or a computer), the documentation was never sent to its final destination.
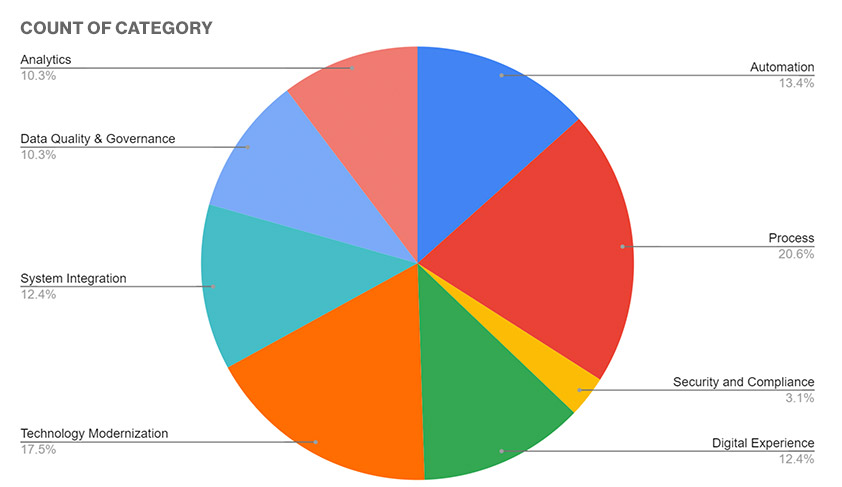
Once we completed the gap analysis, we then categorized the gaps by remediation category. We ended up with this breakdown:

This process mapping engagement revealed numerous gaps and pain points in the systems and opportunities for improving business processes.
By analyzing the remediation categories of data flow gaps, we were able to bundle initiatives together based on their logical start and stop points. We also prioritized initiatives based on impact. Then we identified “first movers” based on those with fewer dependencies on other areas.
CoStrategix is a digital and data solutions firm that helps organizations lead with technology to achieve business goals. We help you complement your growth strategy with digital technologies, identify new digital revenue streams, and build competitive advantages and operational efficiencies into your core business models. If you would like assistance with improving your data quality through business process mapping, please connect with us.
AI Strategy & Solutions – Elevate your business with advanced analytics
Data & Insights – Drive insights that lead to competitive advantage
Product Development – Build platforms that power unique digital capabilities
Platform & Technology Modernization – Modernize for stellar experiences, efficiency, and AI
Related Blog Posts
Use an Adaptive Project Framework to Drive Innovation
December 18, 2024
Building Usability and Accessibility into Digital Products
October 16, 2024
The Future of SSRS, SSIS, and Microsoft Fabric
September 20, 2024
Considerations for Moving to Microsoft Fabric
August 15, 2024


