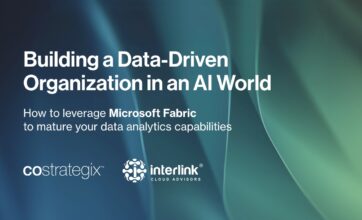
White Paper

Creating Value from Data in Your Modern Data Architecture

White Paper

We discussed in a previous blog how to construct a Data Lake and a Data Warehouse. It turns out that building a modern data architecture is the easy part. Creating value from your data is the hard part, because it means changing ingrained processes and habits to get people to use your data for decision-making.

Blog-Creating-Value-from-Data

In “Field of Dreams,” a disembodied voice from a cornfield tells Kevin Costner “If you build it, they will come.” He builds a baseball field, and hundreds of people drive to his cornfield to hand him money. The lesson to be learned here (and this is very important) is that this movie is a work of fiction. Simply building a baseball diamond in a cornfield does not (by any means) guarantee that people will hand you money. Likewise, building a modern data architecture does not (by any means) guarantee that your company will get value from it.

To create value from your data warehouse, you need to:

  • Engage your people to make them aware of the data and the potential value of the data
  • Build people’s trust in the quality of your data
  • Apply data into existing workflows to make an impact on decision-making
  • Adapt to changing conditions by updating what data you track
Engage Your People

Your people are, for the most part, smart and resourceful (if your HR department is functioning properly). They have found ways to do their jobs for months and years without your help. But now you are asking them to start using a data warehouse. To do that, they have to change what they are already doing. Any change, even if the change is an improvement, is still a change. And so people are going to resist it.

Your job then, is to engage with people. To understand their fears and their motivations. To show them how data can improve their outcomes and give them better results.

Start with messaging
My recommendation is to focus on the idea of “A Single Source of Trusted Data.” People can immediately understand this concept, especially since the No. 1 complaint regarding data is that it is spread across too many systems and databases. People intuitively understand that if everyone has a single view of the data, then it will be easier to reach an agreement on corporate strategy and direction.

“Brand” your data architecture
Give it a name. Call it “Acme,” “Skynet,” or “CDC” (for Company Data Cloud). If the data warehouse has a name, then people can talk about it. You can label the reports or dashboards with the data warehouse’s name so that people know that the data has been validated – and also to build awareness of the usefulness of the data warehouse.

Publish your data catalog
List the available tables and the types of data that can be found in each one. The goal is to make people aware of the data that they may not even realize is available. Save the catalog document as a PDF and send it to people via email. (People may not have time to gain access to a new system, but everyone will be tempted to open a simple PDF called “THE PINNACLE – A SINGLE SOURCE OF TRUSTED DATA.”)

Email monthly reports of usage metrics
Include metrics such as: how often each department has accessed the data warehouse (either directly or through Power BI), and how many queries they have run. The creation of a Data Warehouse is usually a corporate initiative, so bringing attention to how much each department is getting on board with that initiative can be a fun exercise. This can apply some peer pressure and spark some departmental competition, which may help with the adoption rate.

Build Trust in Your Data

Even if people are aware of the Data Warehouse and know what data it contains, they may still be reluctant to use it or to base decisions on the data. That is because of Trust.

If people are going to include the data in a proposal to the Board or show the data in a presentation to their staff, then they want to know that the data can be trusted. And it is up to you to build that trust, and create value from your data.

Explain where the data comes from
If people understand where the data originates, then they will have a better intuition about what the data means, why it is being collected, and how it may be used.

Data sources can be divided into three types:

  • First-Party Data – from your own systems
  • Second-Party Data – from your clients and vendors
  • Third-Party Data – from independent data brokers

Knowing that data comes from internal systems or from clients may immediately improve trust in the data. As for Third-Party data, some vendors, such as the US Census Bureau or Nielsen Analytics, may be well-known to your business users. For smaller or industry-specific data brokers, you may need to provide their qualifications before your users will trust the data.

Explain the data architecture
This includes establishing a chain of ownership from the original data source to the end data available via the data warehouse. This is referred to as the data “Provenance.” The data architecture must also describe how and where the data is stored, and most importantly, any transformations performed on the data as it moves from its source to the warehouse. The data architecture may also include validations and audits performed on the data at various stages. Including these validations/audits in the architecture diagram and documentation can help build trust as well.

Put a human face on the data
Explain the ownership of the end datasets. These are generally the data stewards and SMEs. These are the people who data users can contact with questions or suggestions. Make sure that each activated dataset has an established owner, and explain to the data users the feedback mechanism by which they can contact the owners. Knowing that there is a human being associated with the (otherwise ephemeral) “data” helps your users to establish the level of trust that they need to become fully engaged.

Make an Impact by Integrating Data into Workflows

Data is intrinsic to how your business operates. It should power every business action. Therefore, business users should not have to think about applying data separately from their routine work.

Your business actions are accomplished through (hopefully) already-established processes and workflows. Your primary goal is not to dream up new ways to use data, but rather to determine how to insert the most accurate and actionable data into each of these existing workflows – thereby create value from your data.

Take sentiment analysis as an illustrative example. It does no good to wait until the end of the day, and then provide a sentiment analysis report to each of your customer service representatives (CSRs) saying that 30% of their customers were angry, and 10% of their customers were happy. Instead, the sentiment analysis must be evaluated in real-time, while the customer is still on the phone. The results should directly affect the CSR workflow: Irate customers should be immediately transferred from the Interactive Voice Response (IVR) or chatbot to a human representative; CSR scripts can be modified to offer upsells or streamline the path to problem resolution; etc.

When most folks think of activating data, they think of reports (what happened in the past), dashboards (what is happening right now), and notifications (what do you need to know right now). These are all great tools fed by data analysis. But these cannot exist in a vacuum. They must be tied to the processes and workflows that drive your company.

For example, many product development companies use agile methodologies. During the Sprint Planning phase, the group needs to understand its capacity. This is where a vacation plan report might be useful. The workflow for Sprint Planning can explicitly say “Check the Vacation Plan report.” This demonstrates how data can be directly inserted into a workflow.

Adapt Your Data to Changing Conditions

Data is constantly changing. Your business is constantly changing. So how you leverage your data, and the value you obtain, will also be constantly changing. It is up to you to adapt to that change.

One of the first things you may notice is that some KPIs will become boring. Consider that a while ago, Tesla had customer wait times (the time to receive a shipment of their new car) that were measured in years. The press published numerous articles bemoaning the production problems that plagued the electric car market. But when was the last time you heard news of the Tesla wait times? They are now on the order of a few months and are in line with most other automakers. What used to be a critical KPI within Tesla is now quite boring. At this point, Elon Musk has probably moved his “Customer Wait Time” from a KPI report to an exception report, where it will only be mentioned if it rises above some maximum acceptable threshold. Relegating enterprise KPI to a department-level report, or an exception report, is a great adaptation to a changing operating environment.

Another adaptation is needed when your workflow changes. White Castle, the restaurant chain ubiquitous across the American Midwest, is installing robots called “Flippy” to cook french fries. Previously they may have had metrics to track how long employees spent making fries, how often they made fries, how fresh the fries were that were served to the customer, etc. But now the employee workflow has changed. They no longer make fries at all. So those related metrics must be removed, and replaced with new metrics that focus on the employee’s evolving responsibilities, which now focus more on taking orders and providing customer service. As workflows change, your metrics must adapt to stay relevant.

Consider the data changes that were brought about by COVID-19. As the global pandemic moves further into our rearview mirror, we are finding that our old metrics must now be merged with new data in order to make sense. Life expectancy in the U.S., which had been holding steady at around 79 years, started dropping in 2020. Over the next 3 years, it dropped nearly 4%, down to around 76 years. To make sense of this change, government agencies and healthcare providers needed to incorporate new sources of data, such as COVID-19 infection and vaccination rates. Ingesting new types and new sources of data is key to adapting your data to new realities.

Conclusion

Maintaining a data lake and data warehouse is the first step in creating value from your data. After your data architecture is established, then you must engage people to make them aware of the data and the potential value of data. This requires a degree of “selling” to convince people to make the most of your company’s data assets. Once engaged, you must help build people’s trust in your data. They need to understand where it comes from and how it was handled so that they believe in the accuracy of the data. Once you have gained trust, you need to help people make the data actionable. They need to apply it to their daily workflows and incorporate it into their daily decision-making. And finally, you will need to adapt. Data does not stand still, and neither should you. Recognize the changes in your business and the world signal the need for different metrics, or different data, to ensure that your data products stay relevant and valuable to your data consumers.

CoStrategix is a digital and data solutions company that helps organizations modernize their data architecture to drive value from data. Reach out to us if you would like to learn how we customize every engagement to meet your organization’s business challenges.

Recent Blog Posts

Setting goals for yourself is key to motivation
Setting Goals For Yourself is the Key to Motivation
Blog-Chaos-Engineering-hdr
Embrace the Chaos! Exploring the World of Chaos Engineering
blog-climbing-is-like-solving-it-challenges-header
High-Altitude Climbing is a Lot Like Solving an IT Challenge
Blog-Best-Practices-for-Getting-Started-with-Azure-DevOps
Best Practices for Getting Started with Azure DevOps
Blog-Just-Get-Started-with-LLM-Use-Cases
Just Get Started with LLM Use Cases