Blog

What Are Augmented Analytics? And How to Get Started

Blog

If you haven’t started using augmented analytics yet, why not? 

Blog-Augmented-Analytics

Power BITableau, and most analytics and data science platforms all include augmented analytics capabilities in their platforms. Augmented analytics can give your entire team an edge by enabling you to work faster, more efficiently, and more accurately.

In this primer, we walk you through how to get started with augmented analytics in Power BI Service version (note that PowerBI Service does require a subscription). But first, let’s explore why you should care.

What Are Augmented Analytics?

Augmented analytics are a set of low/no-code or generative AI tools that automate tasks performed during the analytics workflow and help “augment” the user experience. The learning curve is relatively flat, and the heavy lifting has been done for you. This is not rocket science, and you don’t have to learn a new programming language.

Everyone Else Is Using Augmented Analytics

You may be one of the people who use an analytics platform, only occasionally or perhaps every day, but you just haven’t gotten around to using augmented analytics yet. If so, consider this:

In 2022, augmented analytics were used by just 36% of organizations, according to Gartner’s Market Guide to Augmented Analytics. Yet by 2025, Gartner estimates that:

  • Data stories will be the most widespread way of consuming analytics, and 75% of stories will be automatically generated using augmented analytics techniques
  • Context-driven augmented analytics and AI models will replace 60% of existing models built using traditional methods

In short: everyone else is using augmented analytics. Now’s a good time for you to start.

Augmented Analytics Are Simple

If you’re a business analyst, augmented analytics will help by giving people with less mature data skills and experience access to more advanced data science techniques. For instance, you can leverage the AI and ML technologies behind augmented analytics to:

  • Trim the search space, surfacing relevant data and suggesting fruitful paths for analysis
  • Effectively look under every rock for a more thorough analysis (and also, help avoid confirmation bias)

If you’re a developer, augmented analytics will automate many of the repetitive tasks to save time and energy in data preparation, data discovery, and running statistical analyses. (Note that many Power BI developers use the free Power BI Desktop version for at least some of their development tasks, while most of the augmented analytics capabilities reside in the Service version or Premium version, both of which require a subscription.)

How To Get Started

Now, on to the fun part. Here’s how to get started with augmented analytics in Power BI (the process is similar in other platforms, too).

I. Augmented Analytics: Quick Insights Example

1. Open up a workspace in your Power BI Service
(Note: The steps below are not available in the desktop version.)

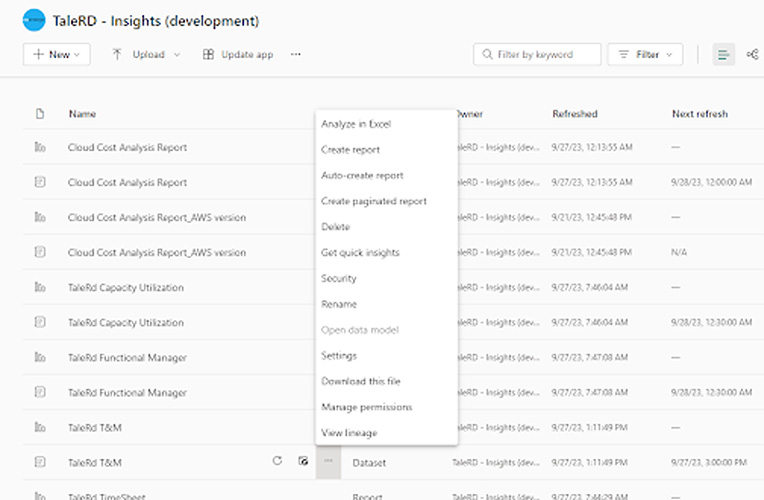
2. Select a dataset, and click on the three dots next to it to find the “Get Quick Insights” option

The Quick Insights option might not be enabled for all datasets, depending on whether the data was statistically significant. So click around to different datasets to find one that is enabled.
Note: The preparation of the insights may take up to 60 seconds, so be patient.

AugmentedAnalytics-inset-01
Example of how to find the “Get Quick Insights” function

3. Look at the Results Dashboard

Power BI Augmented Analytics runs through data checks in the background and generates possible visualizations. This will show all possible insights for the particular data set.

AugmentedAnalytics
Example of what the Quick Insights dashboard might look like

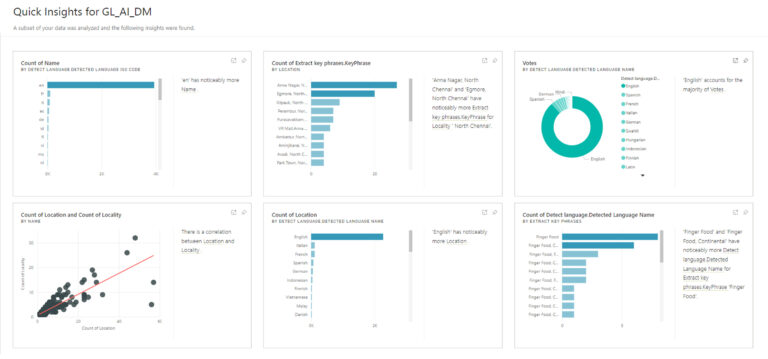
visual tile on your dashboard is a doorway into data exploration. When you select a tile, it opens that chart in a full-screen report, where you can filter and dig into the dataset behind the report. You can pin any of the tiles to an existing or a new dashboard.

The Quick Insights feature is built on a growing set of advanced analytical algorithms developed in conjunction with Microsoft Research that allows people to find insights in their data in new and intuitive ways.

II. Augmented Analytics: Q&A Visuals Example

1. Create a New Report and Pick Any Dataset

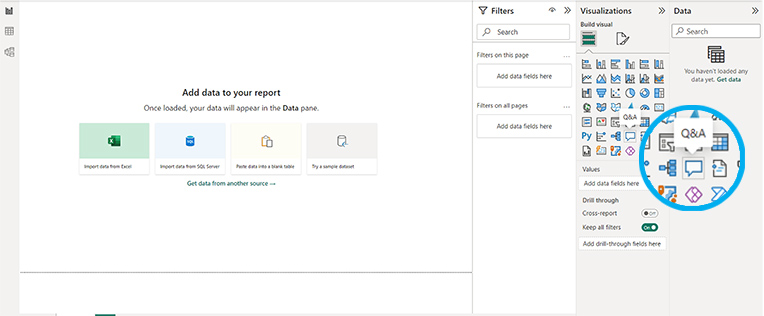
2. Add a Q&A Panel to the Report

Q&A Visuals allows you to ask questions in natural language and get answers in the form of a visual. The Q&A Visuals icon actually looks a lot like a “comment” icon. There are two ways to open Q&A Visuals: a) Click the Q&A Visuals icon from the Visualizations menu. b) A shortcut is to simply double-click on the vacant dashboard.

AugmentedAnalytics
Example of how to access Q&A Visuals functionality from the Visualizations menu
AugmentedAnalytics
Example of how to access the Q&A Visuals function from a vacant dashboard

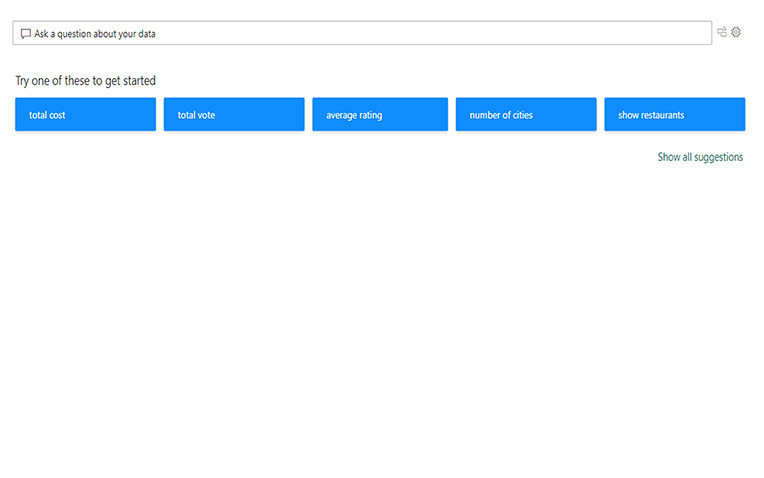
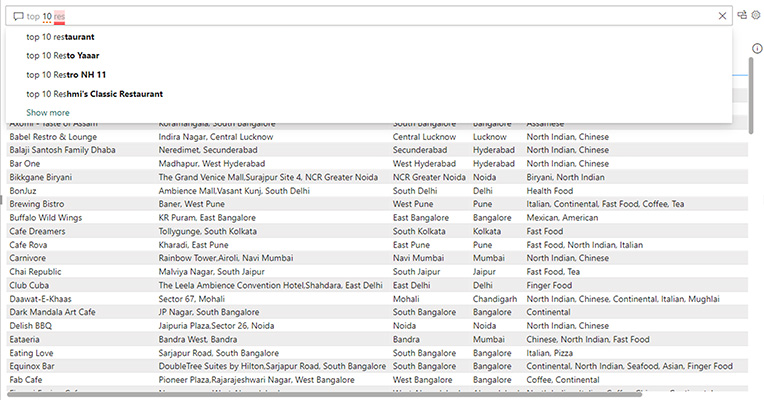
3. Ask any question you may have about your dataset

Insert your query in the search bar to generate recommendations, which will produce visuals. You may use natural language (full sentences or questions), or just phrases.

Power BI leverages Natural Language Processing (NLP) to process the typed query and generate recommendations and visualizations, based on your input.
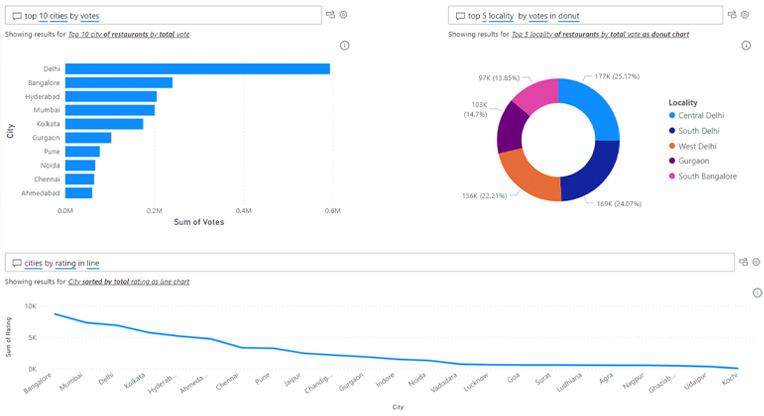
AugmentedAnalytics
Example of how to generate a query in the Q&A Visuals search bar

4. Read the Result

After creation, Q&A Visuals behave like any other visual, supporting cross-filtering, cross-highlighting, and bookmarks. The Q&A Visuals consists of four core components:

  • A question box where you type questions and see suggestions to help find answers
  • A pre-populated list of suggested questions
  • Icon to convert the Q&A Visuals into a standard visual
  • Icon to open Q&A tooling, which allows designers to configure the underlying natural language engine

Analysts can use Q&A Visuals to quickly get answers to data questions. Designers can also use it to create visuals quickly. It supports themes and other default formatting options available inside Power BI.

AugmentedAnalytics
Example of what the Q&A Visuals results might look like
What Can You Do Next?

OK, now you should be able to get started using Augmented Analytics in Power BI. The next important question is – what should you do with all your newfound free time? Here we have a few ideas for you:

  • Explore other datasets
  • Share this with your colleague
  • Pretend this was your idea and wow your boss

CoStrategix is a digital and data solutions company that helps organizations unlock the potential of Data Insights and Artificial Intelligence – transforming user experiences and modernizing technologies to thrive in a fast-changing world. Talk to us if you’re looking to learn more about augmented analytics, AI and advanced analytics, data governance and quality, or delivering continuous insights through DataOps.